
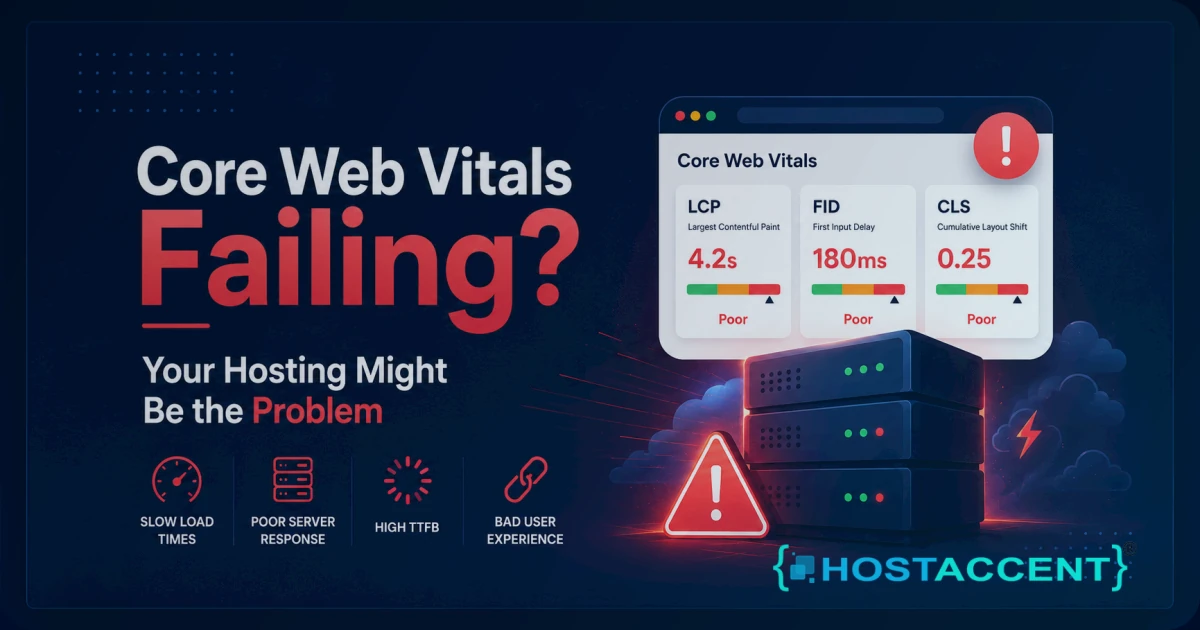
Your Core Web Vitals are failing and you've done the usual things — compressed images, deferred JavaScript, installed a caching plugin. But the scores aren't improving, particularly on mobile. LCP is still in the red. And you're starting to wonder if the problem isn't your website at all.
It might not be. A surprising number of Core Web Vitals failures trace back to hosting — specifically, a slow server response that adds 500ms–2 seconds before your page even starts loading. No amount of image optimization fixes that.
Let me show you how to tell if hosting is your bottleneck, and what to do about it.
Quick Answer: If Core Web Vitals keep failing after you've optimized images and scripts, the bottleneck is usually your hosting. A slow server response (high TTFB) drags LCP into the red no matter what you change on the front end. Enable full-page caching, add a CDN, move to NVMe hosting with dedicated resources, and run PHP 8.3 — then re-test. Front-end tweaks can't rescue a slow server.
The three Core Web Vitals (quick refresher)
Google measures three things:
- LCP (Largest Contentful Paint): How fast does the main content appear? Target: under 2.5 seconds.
- INP (Interaction to Next Paint): How fast does the page respond to clicks/taps? Target: under 200ms.
- CLS (Cumulative Layout Shift): Does stuff jump around while loading? Target: under 0.1.
LCP is the one most affected by hosting. It directly depends on how fast the server sends the first byte of HTML, which determines when the browser can even start rendering.
How hosting affects LCP
LCP timeline:
bashDNS lookup → TCP connection → TLS handshake → TTFB (server processing) → HTML download → Resource loading → LCP element renders
TTFB (Time to First Byte) is the hosting part. It's how long your server takes to generate and start sending the HTML response. Everything else happens after TTFB.
- TTFB of 200ms → LCP has a 2+ second head start on a slow server
- TTFB of 1,500ms → LCP is already 1.5 seconds behind before anything renders
Check your TTFB:
bashcurl -o /dev/null -s -w "TTFB: %{time_starttransfer}s\n" https://yourdomain.com
Run it 5 times and average the result.
| TTFB | Assessment | |------|-----------| | Under 200ms | Excellent — hosting isn't the problem | | 200–600ms | Acceptable — room for improvement | | 600ms–1s | Slow — hosting is contributing to LCP failure | | Above 1s | Your hosting is almost certainly the primary cause of LCP failure |
Is it hosting or is it WordPress?
The trick: test a blank page.
Create a file at /test-ttfb.php:
php<?php echo "OK"; ?>
bashcurl -o /dev/null -s -w "TTFB: %{time_starttransfer}s\n" https://yourdomain.com/test-ttfb.php
- Blank page TTFB high (>300ms): Server/hosting problem. Even without WordPress running, the server is slow.
- Blank page TTFB low (<100ms) but WordPress page TTFB high: WordPress configuration problem — plugins, missing cache, slow queries.
Delete test-ttfb.php after testing.
Hosting-level fixes for LCP
Fix 1: Enable full-page caching (biggest impact)
Without caching, every page request runs WordPress's full PHP stack: load core, load plugins, query database, build HTML. This takes 300ms–2 seconds depending on complexity.
With caching, Nginx serves pre-built HTML in 5–20ms. PHP doesn't run at all.
Check if caching is working:
bashcurl -I https://yourdomain.com | grep -i "x-cache\|x-fastcgi"
If you see HIT — cache is working. MISS every time — it's not.
Nginx FastCGI cache (server-level, most effective):
nginxfastcgi_cache_path /var/run/nginx-cache levels=1:2 keys_zone=WP:100m inactive=60m; server { # ... existing config ... set $skip_cache 0; if ($request_method = POST) { set $skip_cache 1; } if ($cookie_wordpress_logged_in) { set $skip_cache 1; } if ($request_uri ~* "/wp-admin|/cart|/checkout|/my-account") { set $skip_cache 1; } location ~ \.php$ { fastcgi_cache WP; fastcgi_cache_valid 200 60m; fastcgi_cache_bypass $skip_cache; fastcgi_no_cache $skip_cache; add_header X-Cache $upstream_cache_status; # ... rest of fastcgi config } }
This alone can take LCP from 3+ seconds to under 1.5 seconds.
Fix 2: Enable OPcache
OPcache caches compiled PHP bytecode. Without it, PHP recompiles all WordPress files on every request.
ini# /etc/php/8.3/fpm/php.ini opcache.enable=1 opcache.memory_consumption=256 opcache.max_accelerated_files=10000 opcache.revalidate_freq=60
Impact: 20–40% reduction in PHP execution time for uncached pages.
Fix 3: Redis object caching
Database queries add to TTFB. Redis caches query results in memory:
bashsudo apt install redis-server php8.3-redis -y echo "maxmemory 256mb" | sudo tee -a /etc/redis/redis.conf sudo systemctl restart redis
Install Redis Object Cache plugin. Impact: reduces database queries per page load by 40–70%.
Fix 4: Upgrade PHP version
PHP 8.3 is 15–25% faster than PHP 8.0, and drastically faster than PHP 7.4. Check your version:
bashphp -v
Upgrade if you're not on 8.2 or 8.3.
Fix 5: Server location matters
If your server is in the US and your visitors are in Europe (or vice versa), add 100–200ms of network latency to TTFB. No server optimization fixes physics.
Solution: Choose a server location near your primary audience. Or use a CDN for full-page caching at edge locations (Cloudflare APO does this for WordPress at $5/month).
Hosting-level fixes for INP
INP is mostly a frontend JavaScript issue, but hosting affects it indirectly:
- Slow TTFB delays JavaScript loading → interactions are delayed because scripts haven't loaded yet
- Shared hosting CPU throttling → dynamic interactions that hit the server (AJAX, admin-ajax.php) respond slowly
Fix: Ensure admin-ajax.php and REST API endpoints are fast. Redis object caching helps here too.
Hosting-level fixes for CLS
CLS is almost entirely a frontend issue (missing image dimensions, late-loading fonts, injected ads). Hosting doesn't directly cause layout shifts.
One exception: slow external font loading. If fonts load from Google Fonts and the server is slow, the browser renders with a fallback font first, then shifts when the real font arrives.
Fix: Host fonts locally and use font-display: swap in CSS.
When shared hosting is the ceiling
If you've done all the optimizations above and TTFB is still above 600ms, the constraint is likely the shared server hardware. On shared hosting:
- CPU is shared with other sites
- PHP-FPM workers are limited by the host
- You can't configure Nginx FastCGI cache
- OPcache settings are controlled by the host
- Redis may not be available
These are architectural limits you can't fix with WordPress plugins.
The VPS difference: | Factor | Shared hosting | VPS | |--------|---------------|-----| | TTFB (cached) | 200–800ms | 20–100ms | | TTFB (uncached) | 500ms–2s | 200–600ms | | Full-page cache | Plugin-only | Nginx FastCGI (server-level) | | Redis | Often unavailable | Full control | | PHP-FPM tuning | Can't change | Full control |
Moving from shared hosting to a properly configured VPS typically improves LCP by 1–3 seconds. That's often the difference between failing and passing Core Web Vitals.
Test after each change
Don't change everything at once. Make one change, test:
bash# Quick TTFB check curl -o /dev/null -s -w "TTFB: %{time_starttransfer}s\n" https://yourdomain.com # Full Core Web Vitals test # Use PageSpeed Insights: pagespeed.web.dev
Track which changes made the biggest difference. Usually the order is:
- Full-page caching (biggest impact)
- Server location / CDN
- OPcache
- Redis
- PHP version upgrade
Bottom line
Core Web Vitals failing isn't always about your website — sometimes it's about what's underneath it. If your TTFB is above 600ms, start with the server. No amount of image compression makes up for a slow server response.
HostAccent VPS hosting gives you the infrastructure to actually pass Core Web Vitals — NVMe storage, dedicated CPU, full control over caching and PHP configuration. If your current hosting is the bottleneck, this is where the improvement starts.
Related guides from HostAccent
- How to Fix High TTFB in WordPress (2026 Guide)
- WordPress Site Slow: Complete Diagnosis and Fix Guide (2026)
- WordPress Speed Optimization: Hosting-Layer Fixes
- Nginx + PHP-FPM Performance Tuning on Linux VPS
- Best VPS for WordPress in 2026: Specs That Actually Matter
Related guides: WordPress Changes Not Showing? How to Fix It Fast (2026)
<!-- ha:inbound-repair:end -->

Discussion
Have a question or tip about this topic? Share it below — your comment will appear after review.