
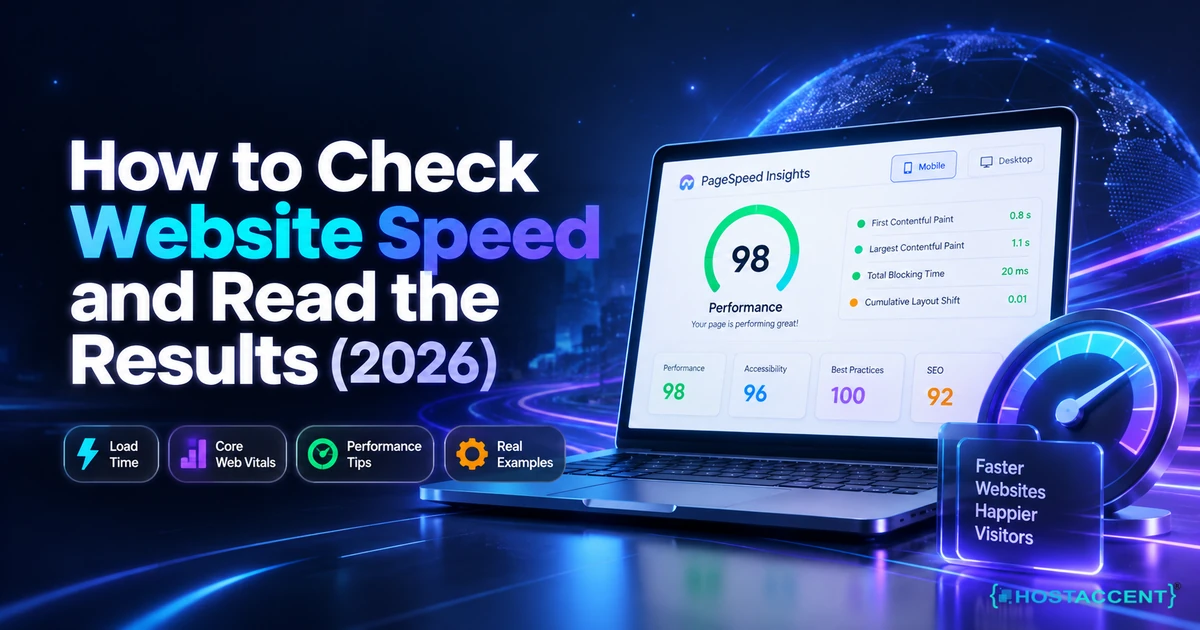
Your site feels fine on your laptop, on office wifi, with everything cached. Then a customer says it took eight seconds on their phone. Knowing how to check website speed is what closes that gap, and it takes about two minutes with free tools. The harder part, the part almost nobody explains, is reading the results: which number blames your server, which blames your theme, and which you can safely ignore.
Quick Answer: Run your page through Google's PageSpeed Insights, then confirm it in a second tool. Ignore the big score at first and read three numbers instead. As of September 2026, good means TTFB under 800ms, LCP under 2.5 seconds and INP under 200ms. A slow TTFB points at your hosting. A slow LCP with a fast TTFB points at your images, fonts or scripts.
We resolve 20 to 30 client issues a day at Hostaccent, and a healthy share of them arrive as a screenshot of a red score with the question "is this your fault or mine?" This guide is written the way an engineer would walk you through that ticket, so you can answer it yourself in ten minutes. No jargon dumps, no vague advice about "optimising". Just the numbers that matter, where to find them, and what each one is actually telling you about your site.
What Website Speed Actually Measures (TTFB, LCP, INP and CLS)
Website speed is four separate measurements wearing one name. Your server response time (TTFB) is how long the browser waits before receiving anything at all. Largest Contentful Paint (LCP) is when the main content appears. Interaction to Next Paint (INP) is how fast the page reacts to a tap. Cumulative Layout Shift (CLS) is how much the layout jumps while loading. Good values in 2026 are 800ms, 2.5 seconds, 200ms and 0.1, measured at the 75th percentile of real visits.
Here is the full reference you can check your own results against:
| Metric | What it measures | Good | Needs work | Poor | | --- | --- | --- | --- | --- | | TTFB (Time to First Byte) | Server response time | 800ms or less | 800ms to 1800ms | Over 1800ms | | LCP (Largest Contentful Paint) | When main content paints | 2.5s or less | 2.5s to 4.0s | Over 4.0s | | INP (Interaction to Next Paint) | Response to taps and clicks | 200ms or less | 200ms to 500ms | Over 500ms | | CLS (Cumulative Layout Shift) | Layout stability while loading | 0.1 or less | 0.1 to 0.25 | Over 0.25 |
Notice what is missing from that table: total website load time. The old "my site loads in 3.2 seconds" number still appears in some tools, but Google stopped treating it as the headline years ago, because it measures the moment the last tracking pixel finishes rather than the moment your visitor can read something. A page can finish loading in 6 seconds and still feel instant, or finish in 2 and feel broken.
The 75th percentile detail matters more than people expect. Google does not average your visitors. It sorts them and looks at the one whose experience was worse than 75% of the rest. So the customer on 4G in a car park counts, and your own fibre connection barely does.
TTFB is the one that quietly caps everything else. It is not a Core Web Vital itself, but it sits at the front of the queue: if your server takes 1.4 seconds to send the first byte, you have already burned more than half your LCP budget before the browser has seen a single image. web.dev's guidance on optimising Time to First Byte puts the target at 0.8 seconds or less for the same reason.
That is why hosting shows up in speed conversations at all. Nothing you do to a hero image can buy back a slow first byte.
How to Check Website Speed in Four Steps
Four steps, about ten minutes. Pick the right page, test it cold, run it three times and take the median, then compare lab data against field data. Doing it in that order is what separates a number you can act on from a number that changes every time you refresh. Most people stop after one run of the homepage, which is exactly how you end up chasing a problem that was never there.
1. Test the page that actually matters. Your homepage is often your lightest page. Test the product page, the long blog post, the checkout, the page people land on from Google. If a page template is slow, every page built on it is slow, so pick one page per template rather than testing forty URLs.
2. Test it logged out, in a private window. Logged-in sessions bypass page caching on most stacks, so you measure the slowest possible version of your site and panic for no reason. Admin toolbars, editor scripts and session cookies all skew the result.
3. Run it three times and take the middle result. Lab tests simulate a throttled mobile device, and simulation is noisy. One run tells you almost nothing.
Pro Tip: Discard the first run entirely. It includes DNS resolution and a cold cache, so it is consistently the worst of the three. Take the median of runs two and three, and write both numbers down with the date. A single score is trivia. A number you can compare against next month is data.
4. Read the field data before the lab score. Open Google's PageSpeed Insights tool, paste your URL, and look at the top section first. That block is real Chrome user data collected over the previous 28 days from actual visitors. The colourful score underneath it is a simulation run on Google's hardware. When the two disagree, believe your visitors.
If the field data section says there is not enough data, your site simply does not get enough Chrome traffic yet. That is not an error, and it is not something you can fix with a plugin. Use the lab score and your own TTFB reading instead, and check back once traffic grows.
One more thing worth doing on the same pass: test both mobile and desktop separately. They are graded separately, they usually differ by 20 to 40 points, and mobile is the one Google weighs for most sites. If your mobile result is the one that is red, that is where your weekend goes.
Website Speed Test Tools Worth Your Time (and What Each One Is For)
You need two website speed test tools, not six. One that shows real-user field data, and one that shows you a waterfall so you can see which specific file is holding things up. Everything beyond that is a second opinion you rarely act on. Here is what each of the common options is genuinely good at, and where each one will mislead you if you trust it alone.
| Tool | Best for | Watch out for | | --- | --- | --- | | PageSpeed Insights | Real-user field data plus a Core Web Vitals test verdict | The lab score is a simulation, not your visitors | | Chrome DevTools (Lighthouse) | Free waterfall on your own machine, no queue | Your local wifi and extensions distort results | | WebPageTest | Testing from a specific city, filmstrip view | Slower to run, more settings to get wrong | | GTmetrix | Readable waterfall for non-developers | Free tier tests from limited locations | | curl on any terminal | The fastest way to measure TTFB alone | Tells you nothing about front-end rendering |
That last row is the one most site owners have never tried, and it is the most useful thirty seconds in this whole article. To measure TTFB without any tool at all, open a terminal and run:
bashcurl -o /dev/null -s -w "TTFB: %{time_starttransfer}s\nTotal: %{time_total}s\n" https://yoursite.com/
Run it three times. If time_starttransfer comes back at 0.2 seconds, your server is fine and you can stop blaming your host. If it comes back at 1.6 seconds, no front-end work will save you.
Insider Insight: Add a random query string to the end of the URL, like
?nocache=99172, and run it again. That bypasses most page caches and CDN edge caching, so you see what your origin server really does when it has to build the page from scratch. A site that reads 180ms cached and 2.4 seconds uncached is running on an overloaded server that is being hidden by its cache, and every first-time visitor to a fresh URL feels it.
Location matters too. A test run from a server three miles from your datacenter will flatter you. If half your customers are in Sydney and your origin is in Virginia, test from Sydney and accept the number you get. That is your customer's reality, not the optimistic one.
If a test fails to complete at all rather than returning a slow number, you have a different problem. Start with This Site Can't Be Reached? 7 Fixes That Work (2026), because that is a connectivity or DNS fault, not a performance one.
Still chasing the performance bottleneck?
Share the slow pages, timing data, and recent changes. We can isolate application, database, network, and server bottlenecks before recommending work.
What Your PageSpeed Insights Score Really Means
A PageSpeed Insights score of 90 or above is good, 50 to 89 needs improvement, and below 50 is poor. It is a weighted blend of five lab measurements, with LCP, Total Blocking Time and CLS carrying about 80% of the weight. The score itself is not a ranking factor. The underlying Core Web Vitals feed into Google's page experience signals, and that is the part worth fixing.
The scale is harsher than it looks, which is why so many owners think their site is broken when it is merely average. Scoring 50 places a page roughly in the top quarter of all pages measured by HTTP Archive. That orange badge is not a failing grade. It is a middling one wearing a warning colour.
Looking at the pattern in Hostaccent's support queue through 2026, roughly a third of the "my site got slow" tickets we open arrive with a screenshot showing a mobile score in the 30s next to a desktop score in the 90s, and the site is running perfectly well. The mobile test throttles the CPU to imitate a mid-range Android phone on a slow connection. Your desktop result is the fantasy. Your mobile result is closer to the customer.
Do I actually need to switch hosts to fix this?
Usually not, and anyone who tells you otherwise before looking at your TTFB is selling something. If your server responds in under 500ms and your score is still poor, the problem is sitting in your own theme: an uncompressed hero image, four font weights you never use, a chat widget, a heatmap script, a page builder loading its entire library on every page. That is a weekend of work, not a migration.
Switching only helps when the server is genuinely the ceiling. The next section is how you tell.
One more honest word about the number itself: stop chasing 100. Going from 92 to 100 usually means stripping out features your visitors actually use, and Google's own documentation treats 90 as good. The effort is better spent on the page people convert on. If your traffic is the real concern rather than your score, Website Not Getting Traffic? 12 Reasons and Fixes (2026) covers the causes that a faster page alone will not solve.
The 800ms Split: Is It Your Host or Your Front End?
Here is the diagnostic we use, and you can run it in five minutes. Compare your uncached TTFB against your LCP. If TTFB is over 800ms, the server is your ceiling and front-end work is mostly wasted. If TTFB is under 800ms but LCP is over 2.5 seconds, your hosting is fine and the weight is in your own page. We call it the 800ms Split, because that single threshold decides which half of the problem you own.
Step one: get an uncached TTFB using the curl command above with a random query string. Step two: read your LCP from the field data in PageSpeed Insights. Step three: put the two numbers side by side.
Slow TTFB, slow LCP. Server-side. Look at your database, your PHP version, your cache configuration, and whether you are sharing a box with too many neighbours. MDN's definition of Time to First Byte is a useful reminder of what is bundled into that measurement: redirects, DNS lookup, TCP and TLS handshakes, and only then your server's own processing.
Fast TTFB, slow LCP. Front-end. Your server did its job in 200ms and then the browser spent three seconds downloading a 2.8MB PNG. Compress the hero image, set explicit width and height attributes, preload the LCP element, and cut render-blocking JavaScript.
Slow TTFB only on some pages. Almost always a database or cache miss on specific templates: search results, filtered archives, cart pages, anything that cannot be cached.
Across the 4,000+ sites Hostaccent has migrated since 2016, the most common cause of a genuinely bad TTFB is not underpowered hardware at all. It is a redirect chain nobody remembers adding. A request hits http, redirects to https, redirects again to the www version, then redirects a third time for a trailing slash, and each hop costs a full round trip before the server has done any work. Three hops on a mobile connection can add 600ms to a page that is otherwise healthy. If you suspect this, our guide to 301 Redirect htaccess Setup: Copy-Paste Examples 2026 shows how to collapse those chains into one hop.
The second most common cause is a PHP process queue that has run out of workers, which looks like intermittent slowness rather than constant slowness. Your site is quick, quick, quick, then takes four seconds, then is quick again. That pattern is a resource problem, and the evidence is usually sitting in your logs. cPanel Error Log: Where to Find It and How to Read It walks through finding it.
Speed Test Mistakes That Make the Numbers Lie
Five mistakes account for most of the wasted afternoons we see. Testing only the homepage, testing while logged in, testing once instead of three times, testing from the wrong continent, and treating a CDN reading as proof the origin server is healthy. Each one produces a confident number that describes something other than your visitors' experience, and the last one is genuinely dangerous.
Testing only the homepage. It is usually your simplest page. Your revenue pages carry the sliders, the review widgets and the product galleries.
Testing while logged in. Caching is bypassed for logged-in users on nearly every stack. You are measuring your worst case and calling it your average.
Testing once. Lab runs vary by 10 points or more between runs on the same page with nothing changed. Three runs, take the middle one.
Testing from one location. A single test tells you how fast your site is for people near that one test server. Nothing else.
Trusting a cached reading. This is the one that hides real problems for months. Your CDN serves a cached copy from an edge node near the test server, returns a beautiful 90ms TTFB, and the origin behind it is quietly taking two seconds. Every visitor hitting an uncached URL gets that two seconds. Cloudflare's explainer on how a CDN works is worth ten minutes if this is new, because a CDN is a genuinely excellent tool that also happens to be excellent at hiding a struggling origin.
Pro Tip: Before you change anything, record a baseline: date, URL, device, TTFB, LCP, INP and the overall score, in a spreadsheet. Change one thing. Re-test. Most optimisation work fails not because the fixes were wrong but because five changes went live at once and nobody could tell which one helped, or which one broke the contact form.
One last caution. If a page starts returning errors rather than loading slowly after you install a caching or optimisation plugin, that is a configuration fault rather than a performance one, and 400 Bad Request Error: How to Fix It in 2026 (All Fixes) covers the usual culprits. Industry data from the HTTP Archive's 2025 Web Almanac found only about 48% of mobile sites and 56% of desktop sites pass all three Core Web Vitals, so if you are in the middle of the pack you are in very normal company. That is not a reason to relax, but it is a reason not to panic.
Your Next Step: A Server That Passes Its Own Test
Here is what to take away:
- Read TTFB, LCP and INP before you read the overall score.
- Run every test three times, logged out, and take the median.
- Under 800ms TTFB means the server is fine and the work is yours.
- Over 800ms uncached means no front-end fix will rescue the page.
- Test the page that earns money, not the homepage.
Now that you know how to check website speed and which number blames which layer, the fix splits cleanly in two. The front-end half is yours to do this weekend. The server half is either hours of tuning or something that just comes correct out of the box. Our shared plans run on NVMe storage with Cloudflare in front, free SSL, a 99.99% uptime guarantee and 24/7 support from our own engineers, starting at Economy — $1.99/mo, which renews at $1.99/mo rather than jumping in year two. One honest limit: Economy is sized for a single site, so if you are running five client projects, Standard at $4.58/mo is the sensible pick. When you are ready, start on the Economy plan and tell Hostaccent what your current TTFB is, and there is a 30-day money-back guarantee if the numbers do not move.
Frequently Asked Questions About Checking Website Speed
How to check website speed without installing anything?
Open a private browser window, go to PageSpeed Insights, paste the full URL of the page you care about, and run it for both mobile and desktop. That takes about 60 seconds and needs no plugin, no account and no access to your server. For a server-only reading, a single curl command from any terminal returns your TTFB in under a second. Avoid speed-test plugins entirely, since they add weight to the very site you are measuring.
What is a good website load time in seconds?
Aim for your main content to appear within 2.5 seconds on mobile, measured at the 75th percentile of real visits. That is the LCP threshold Google treats as good. Total load time is a weaker target because it includes assets your visitor never waits for, but under 3 seconds is a reasonable rule of thumb. Anything over 4 seconds for main content is classed as poor and will cost you both conversions and page experience signals.
Why is my PageSpeed score different every single time I run it?
Because the lab test is a simulation, and simulations vary. Google throttles the CPU and network to imitate a mid-range phone, and the exact conditions, plus any third-party scripts and ads on your page, shift slightly between runs. Swings of 5 to 10 points with no changes at all are completely normal. Run the test three times, discard the first, and take the median. Field data from real users is far more stable than any lab score.
Does website speed actually affect Google rankings in 2026?
Yes, but less dramatically than most articles imply. Core Web Vitals feed into Google's page experience signals, so LCP, INP and CLS carry real weight, while the PageSpeed Insights score itself is not a ranking factor at all. Speed rarely outranks relevance: a slow page with the best answer still beats a fast page with a weak one. Where speed genuinely decides things is between two pages of similar quality, and in conversion rate.
How do I know if my web hosting is the reason my site is slow?
Measure your uncached TTFB. Add a random query string to your URL to bypass caching, run the curl command three times, and take the median. Consistently over 800ms with a lightweight page points at the server. Under 500ms means your hosting is doing its job and the weight is in your front end. On Hostaccent's shared stack, Cloudflare sits in front of Nginx and Apache, and we check exactly this split before ever recommending a plan change.
How often should I run a Core Web Vitals test on my site?
Monthly is enough for a stable site, plus immediately after any theme update, plugin addition or redesign, since those are what actually break performance. Check field data in Search Console monthly, because it reports on a rolling 28-day window and will not reflect yesterday's fix. If you run an online store, test your cart and checkout before every seasonal peak. Those pages cannot be cached and behave differently under real traffic load.
Written and reviewed by The Hostaccent Team, hosting since 2016 and UK-incorporated in 2018 (Companies House No. 11431799), with 10,000+ clients served across 14 datacenter locations. Updated September 2026.



Discussion
Have a question or tip about this topic? Share it below — your comment will appear after review.