
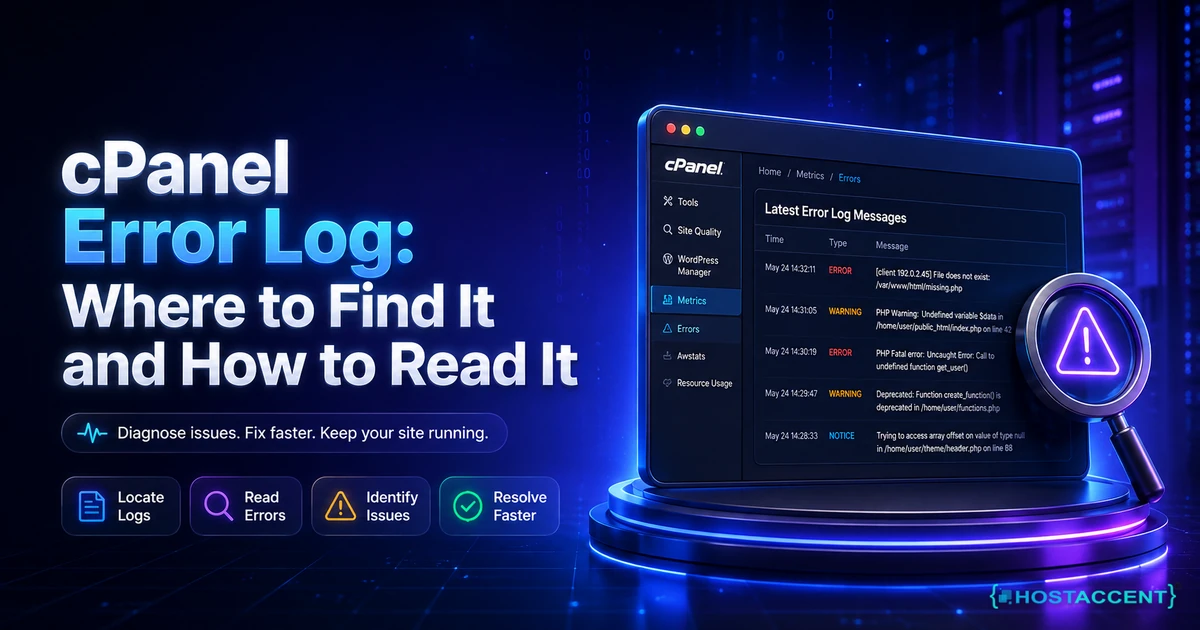
Quick Answer: The cPanel error log lives in two main places. For a fast look, open cPanel and go to Metrics > Errors, which shows the last 300 Apache error entries for your site. For the full record, open File Manager and read the
error_logfile insidepublic_html. As of 2026, that viewer only scans the most recent 2 MB of each file, so a busy site can push older errors out of sight.
Your site just threw a 500 error, went white, or started refusing logins, and the advice everyone gives is the same: check the cPanel error log. Fair enough. Except nobody tells you which log, where it actually hides, or how to make sense of the wall of timestamps once you open it.
This guide closes that gap. You will learn where every relevant log sits, how to read a single entry line by line, and why the log sometimes looks completely empty while your site is clearly broken.
We fix this kind of thing constantly. Our support desk works through 20 to 30 site issues on an average day, and a large share of them start with someone reading, or misreading, one of these files. So the steps below are the same ones our engineers run, written so you can run them yourself. On a managed stack like Hostaccent's, reading the log is usually the first thirty seconds of any ticket, because the answer is nearly always sitting in there in plain text once you know what to look at.
One reassurance before we start. An error in the log does not mean your server is dying. Most entries are harmless noise. The real skill is telling signal from noise, and that is entirely learnable.
Where the cPanel Error Log Actually Lives
There is no single cPanel error log. There are several, and picking the wrong one wastes hours. A standard account keeps site errors in three spots: the Metrics > Errors viewer (the last 300 Apache entries), a per-directory error_log file inside public_html, and, when the feature is switched on, per-domain files under /home/<user>/logs/. Knowing which is which saves you the most time.
The built-in viewer is the friendliest starting point. It reads from the server's global Apache log and shows recent entries in reverse order, newest first. That global file has different paths depending on your server's Apache build: on EasyApache 3 it lives at /usr/local/apache/logs/error_log, and on EasyApache 4 (standard in 2026) it sits at /etc/apache2/logs/error_log. On a plain VPS or dedicated box without cPanel, the same log is usually under /var/log/httpd/ or /var/log/apache2/ instead.
So where are cPanel error logs kept beyond that global file? Two other places matter. First, the per-directory error_log that PHP drops into whichever folder a failing script runs from, most often public_html/error_log. Second, per-domain logs at /home/your-user/logs/your-domain.error.log, which only exist if per-domain error logging is enabled. Access logs (who visited, not what broke) are separate again, under domlogs.
Here is the honest access caveat. On shared and reseller plans, you usually get the viewer and File Manager only. Full shell paths are locked down for security, which is normal and correct. VPS and dedicated users get the lot. If you are unsure which log is authoritative for your setup, the Apache log files documentation explains how the server decides where to write.
Pro Tip: On a server with SSH, find every stray log in one shot:
find /home/$USER/public_html -type f -name error?log. The question mark matches one character, so it catches botherror_loganderror.log. Add-mmin -30to list only files touched in the last half hour, which is gold during a live incident.
How to Open the cPanel Error Log, Step by Step
The fastest route takes under a minute. Log in to cPanel, find the Metrics section, and click Errors. The viewer loads the last 300 Apache entries for your account, newest at the top, each showing a timestamp, the error type, the visitor IP, and the file involved. For most 404s and permission problems, that screen alone tells you the answer.
When you need the raw file rather than a trimmed view, use File Manager. Open File Manager, enter public_html, and look for a file named error_log. Click it and choose View to read the contents in a popup. This matters because the Metrics viewer scans only the last 2 MB of each log, so on an actively erroring site the entry you need may already be off the bottom. The raw file holds more history. If a specific app is broken, check that app's own folder too, since PHP writes its error_log next to the script that failed.
To view the Apache error log in cPanel at the file level, the same two doors apply: the Metrics viewer for a quick read, File Manager for the whole thing.
Do I need SSH access, or can I do all of this inside cPanel?
For nearly everything here, no shell is required. Shared and reseller customers can find, open, and read every relevant log from the Metrics viewer and File Manager alone. SSH only becomes useful on a VPS or dedicated server, where you can watch new lines land in real time. If you have it, the single most useful command is tail -f /usr/local/apache/logs/error_log, which streams the log live while you reload the broken page in another tab. You see the exact error appear the moment it happens.
That live-tail trick is how you tie a symptom to a cause with certainty, instead of guessing. Reproduce the fault, watch the new line, and you have your culprit. If your errors trace back to speed or timeout problems rather than crashes, our guide on how to fix high TTFB in WordPress picks up where this one ends.
How to Read a cPanel Error Log Entry
Every Apache log line follows the same shape, and once you see the pattern you can scan a hundred lines in seconds. A modern (Apache 2.4) entry carries five parts: a timestamp, a module and severity tag such as [core:error], a process ID, the client IP and port, and the message, often with a code like AH01234. Older lines are simpler, for example [Fri May 17 21:07:47 2013] [error] [client 122.96.59.103] File does not exist.
Severity is the field most people skip, and it is the one that matters. Levels run [debug], [info], [notice], [warn], and [error], roughly quietest to loudest. The vast majority of a busy log is [notice] and [info]: startup messages, SSL init, graceful restarts. Those are normal. Train your eye to jump straight to [error] and [warn] and ignore the rest.
A few messages come up again and again, so learn them once:
- File does not exist — a missing file or a wrong path, usually behind a 404. Check the filename against what is actually on disk.
- Premature end of script headers — a script died before sending output, the classic 500 Internal Server Error. Look for a matching PHP fatal nearby.
- client denied by server configuration — a permissions or
.htaccessblock, often a 403. A stray rule in.htaccessis a frequent cause; our 301 redirect .htaccess guide shows how a single bad line cascades into errors. - ModSecurity / mod_security — a firewall rule blocked the request. Not a bug in your code, a security filter doing its job.
In our own support desk, brute-force and malware account for roughly 25% of monthly tickets, and their fingerprints (repeated denied requests from one IP) show up in these logs before anything else does. If a code starts with AH, it maps to Apache's own reference; if you are matching status numbers to meaning, the HTTP response status codes reference on MDN is the fastest lookup.
Pro Tip: On a VPS, cut the noise instead of scrolling past it.
tail -200 /usr/local/apache/logs/error_log | grep -iE "PHP Fatal|PHP Warning"shows only PHP faults;grep -v "notice"strips the routine chatter. Ninety percent of reading a log well is filtering out the lines that were never the problem.
Where PHP Errors Hide (and Why the Viewer Misses Them)
The Metrics viewer only shows Apache errors, not PHP application errors. This one fact trips up more people than any other. Your WordPress plugin can fatal-crash a page, and the built-in Errors screen shows nothing, because that error went to a separate PHP log the viewer never reads. If your site is broken but the viewer is quiet, you are almost certainly looking in the wrong file.
The cPanel PHP error log location is not fixed. By default, PHP writes to an error_log file in the folder where the failing script runs, so a broken theme file usually logs to public_html/wp-content/.../error_log or straight to public_html/error_log. On modern PHP-FPM setups, general handler errors also collect at /usr/local/cpanel/logs/php-fpm/error.log. WordPress has its own switch entirely: set WP_DEBUG and WP_DEBUG_LOG in wp-config.php and it writes to wp-content/debug.log, which the official WordPress debugging documentation walks through.
To make sure PHP is logging at all, open Select PHP Version under Software, click Switch to PHP Options, set log_errors to On and error_reporting to E_ALL, then save. For per-domain control, the MultiPHP INI Editor lets you set log_errors = On and point error_log at a specific path. The PHP error-handling configuration reference documents each directive.
According to Hostaccent's own support-queue data as of 2026, WordPress issues make up about 30% of the tickets we handle, and a big share of those get diagnosed straight from a PHP log the built-in viewer never displays. One firm rule: keep display_errors set to Off on any live site. Turning it on prints raw errors, file paths, and sometimes database credentials directly onto your public pages. Log them quietly, never show them. If PHP errors trace back to memory or process caps rather than code, see shared hosting resource limit exceeded: causes and fix.
Live site and no time to experiment? Editing PHP settings on a production server is exactly where small mistakes get expensive. Our engineers fix this class of error for a small one-time fee, and you see the exact quote before we touch anything. Hosted with Hostaccent already? Then issues like this are simply covered by support, at no extra cost. Have an engineer fix it.
Why the Log Looks Empty or Won't Show Errors
When the cPanel error log is not showing anything while your site is plainly broken, one of four things is nearly always true, and none of them mean the server ate your errors. Work through them in order and you will find where the entries actually went within a couple of minutes.
First, logging may simply be off. If log_errors is set to Off in your PHP options, PHP records nothing, so switch it On as described above. Second, you may be reading the wrong log. The Apache viewer stays quiet for PHP-level faults, so check the per-directory error_log and any custom path instead. Third, the viewer's own limits hide history: it shows the last 300 entries and scans only the last 2 MB, so on a site erroring fast, the line you want scrolled off. Open the raw file for the full picture.
The fourth cause is the one almost no other guide mentions.
Insider Insight: On servers running PHP-FPM (common in 2026), per-directory
php.inifiles insidepublic_htmlare ignored. So if you dropped aphp.iniinto a folder to force logging and nothing happened, that is expected behaviour, not a broken account. Use the MultiPHP INI Editor to setlog_errorsat the account or domain level instead, and the entries appear.
A fifth, quieter reason is log rotation. Logs get rotated and archived on a schedule, so an error from last night may already have moved to a compressed archive. If you need to keep more history, avoid clearing logs by hand mid-investigation. Blank output almost never means "no error occurred"; it means the error is in a file you have not opened yet.
How to Confirm the Fix and Keep the Log Quiet
Confirming a fix takes one deliberate step that most people skip: reproduce the exact action that caused the error, then watch the log to see whether a fresh line appears. If you can trigger the broken page and the log stays silent, the fix held. On a VPS, keep tail -f running on the log in one window while you reload the page in another, so you get instant confirmation instead of hopeful guessing.
Once it is genuinely fixed, tidy up so the log stays readable. Set display_errors back to Off if you turned it on. On a busy site, dial error_reporting down from E_ALL to something like E_ALL & ~E_NOTICE & ~E_DEPRECATED, because notices and deprecation warnings bury the real errors under noise. A log you can actually scan is worth far more than one that captures every trivial hiccup.
Prevention is mostly about noticing early. Skim the Errors viewer once a week even when nothing is obviously wrong; broken links, missing images, and slow scripts leave traces there long before a visitor complains. Recurring 500s or timeouts in the log often point at an under-resourced server rather than your code, and slow-loading pages frequently show up as PHP warnings first. If yours do, WordPress site slow: complete diagnosis and fix guide and Core Web Vitals failing? Your hosting might be the problem both start from the same log evidence.
The habit our engineers rely on is what we call the Three-Log Rule: before touching a single file, check three logs in order, the Metrics viewer, the per-directory error_log, and the PHP or custom log. Ninety percent of the time, the answer is sitting in one of those three, and you have saved yourself an afternoon of blind edits. As a company operating since 2012 and UK-incorporated in 2018, with 10,000+ sites launched, that order is the one pattern that holds across almost every ticket.
Your Next Step: Read It, or Hand It Off
You now know the cPanel error log better than most site owners ever will: where the files sit, how to read a line, and why it sometimes looks empty. Fixed your issue? Set display_errors back to Off and save the file path, so next time takes two minutes instead of twenty. On a well-run server, this whole class of problem is support's job, not yours. That is the quiet advantage of hosting with Hostaccent: our own engineers watch the stack so you don't have to. If you want that, start on the Economy shared hosting plan at $1.99/mo, on NVMe SSD storage with a 99.9% uptime guarantee and a 30-day money-back guarantee. Economy suits a single site; if you run several, Standard fits better. Still stuck right now? Open a ticket and have an engineer fix it, and you will see the exact quote before any work starts.
Frequently Asked Questions About the cPanel Error Log
Where are cPanel error logs stored on the server?
On a standard cPanel account, your web errors sit in three spots. The built-in viewer under Metrics > Errors reads from the global Apache log, which on EasyApache 3 lives at /usr/local/apache/logs/error_log and on EasyApache 4 at /etc/apache2/logs/error_log. Your account also gets a per-directory error_log inside public_html, and if per-domain logging is enabled, separate files under /home/your-user/logs/. Shared plans usually expose only the viewer and File Manager for security reasons.
Why is my cPanel error log empty or not showing errors?
An empty cPanel error log almost always means one of four things. PHP logging may be switched off, so set log_errors to On in Select PHP Version. The fault may be PHP-level and written to a custom file the Apache viewer never reads. The viewer scans only the last 2 MB and shows 300 entries, so a busy site can bury older errors, in which case open the raw file. Or overnight log rotation cleared it. Blank rarely means no error occurred.
How do I view the Apache error log in cPanel?
The quickest route is Metrics > Errors, which shows the last 300 Apache entries in reverse order, newest first. For the complete file rather than a trimmed view, open File Manager, enter public_html, and open error_log directly. On a VPS or dedicated server with shell access, run tail -f /usr/local/apache/logs/error_log to watch new lines arrive live while you reproduce the problem. Shared accounts are usually limited to the viewer and File Manager routes, which is enough for most cases.
How do I turn on PHP error logging in cPanel?
Open Select PHP Version under the Software section, click Switch to PHP Options, set log_errors to On, and set error_reporting to E_ALL. Save, and PHP writes warnings and fatals to an error_log file in the folder the failing script runs from. Keep display_errors set to Off on any live site, because turning it on prints file paths and sometimes credentials onto your public pages. Revert error_reporting once you finish, since full reporting gets noisy on a busy server.
What do the numbers and codes in a log entry mean?
Each Apache line carries a timestamp, a module and severity tag like [core:error], a process ID, the visitor IP and port, and a message, often with a code such as AH01234. Severity climbs from [debug] and [notice] through [warn] to [error], so jump to the last two. Codes starting with AH map to Apache's own reference. A 500 points to a script or permission fault, a 403 to a blocked resource, and "File does not exist" to a missing file or bad path.
Should I read the log myself or ask my host to fix it?
Both are valid, and it depends on how much time and nerve you have mid-incident. Reading it yourself is a genuinely useful skill and often faster than waiting, especially for plain cases like a missing file or a fatal PHP error. For anything deeper, a good host should treat log analysis as part of support. If you host with Hostaccent, our engineers will walk the log with you, though we still think every owner benefits from learning to read one confidently.








Discussion
Have a question or tip about this topic? Share it below — your comment will appear after review.