
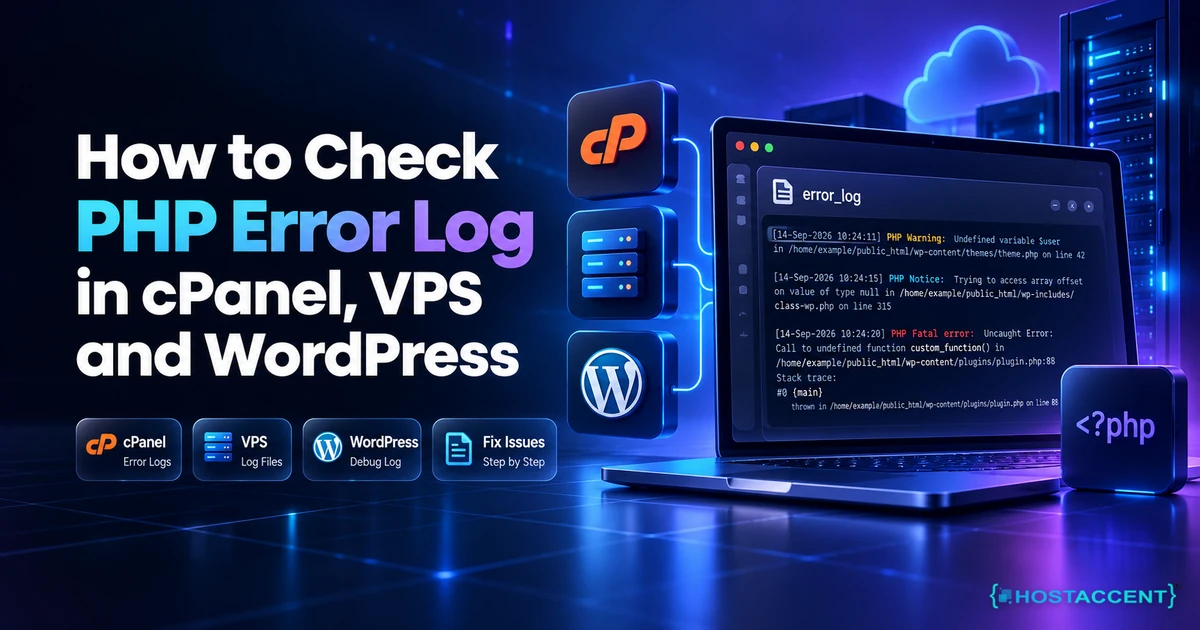
Your site loads a blank white page. No message, no stack trace, nothing useful in the browser console. Meanwhile, somewhere on the server, PHP already wrote down exactly what broke and at what second, in plain text, and almost nobody opens that file.
Learning how to check PHP error log output is the one skill that turns a mystery white screen into a five-minute fix.
Quick Answer (as of September 2026): Check three places in this order. Your control panel viewer first (in cPanel, Metrics > Errors shows the last 300 entries). Then the error_log file in your document root or ~/logs/ folder. Then the server-level files at /var/log/php8.3-fpm.log and /var/log/nginx/error.log. If all three are empty, PHP logging is switched off and must be enabled before anything appears.
Our engineers work through 20-30 client issues every day, and the opening move on nearly all of them is identical: stop guessing, read the log. This guide is written so you can do that part yourself, whether you are on shared hosting, a virtual server, or inside WordPress.
Where that file actually lives depends entirely on your stack. On a stack like Hostaccent's, where Cloudflare fronts an Nginx reverse proxy that passes to Apache, a single fatal error can land in any one of four files. Which one you open first decides whether this takes five minutes or five hours.
Where Is PHP Error Log Located? Start With These Paths
PHP writes errors to whatever path the error_log directive points at, and that path changes with every handler, panel and distribution. There is no universal location, which is precisely why so many people give up at this step.
Start with the table below. It covers the setups that account for the overwhelming majority of real-world sites in 2026.
| Environment | Default PHP error log path | How to open it |
| --- | --- | --- |
| cPanel shared account | ~/logs/example_com.php.error.log or error_log in the document root | File Manager, or Metrics > Errors |
| Apache with mod_php (Ubuntu/Debian) | /var/log/apache2/error.log | SSH, tail |
| Apache (CentOS, RHEL, AlmaLinux) | /var/log/httpd/error_log | SSH, tail |
| Nginx + PHP-FPM (Ubuntu 24.04, PHP 8.3) | /var/log/php8.3-fpm.log plus /var/log/nginx/error.log | SSH, tail |
| Plesk | /var/www/vhosts/example.com/logs/error_log | Plesk Logs viewer |
| WordPress with debugging on | wp-content/debug.log | File Manager, FTP or SSH |
| Custom php.ini | Whatever error_log is set to | Read it with ini_get() |
Guessing from a table is fine as a first pass. Asking PHP directly is better. Drop a one-line file into your document root called checklog.php containing <?php echo ini_get('error_log'); then load it in your browser. The path it prints is the truth for that exact site, on that exact handler. Delete the file the moment you have your answer.
Worth knowing: PHP's behaviour here is documented in the PHP runtime error configuration directives, and when error_log is empty, messages fall through to the web server's own log instead, which is why Apache's log file documentation is often the second place to look.
Pro Tip: Running
php -i | grep error_logover SSH is the classic time-waster. That reads the CLI configuration, and CLI almost always uses a differentphp.inithan PHP-FPM does. The number it shows you can be completely unrelated to what your website is running. Useini_get()from a web request instead.
If your log points at a 502 rather than a PHP fatal, the cause sits further up the chain and the 502 Bad Gateway Nginx: How to Fix It (Step-by-Step) guide will get you there faster.
How to Check PHP Error Log in cPanel (Three Routes)
In cPanel, three routes exist and they show different things. Most people only ever learn the first one, then conclude their host is hiding the logs.
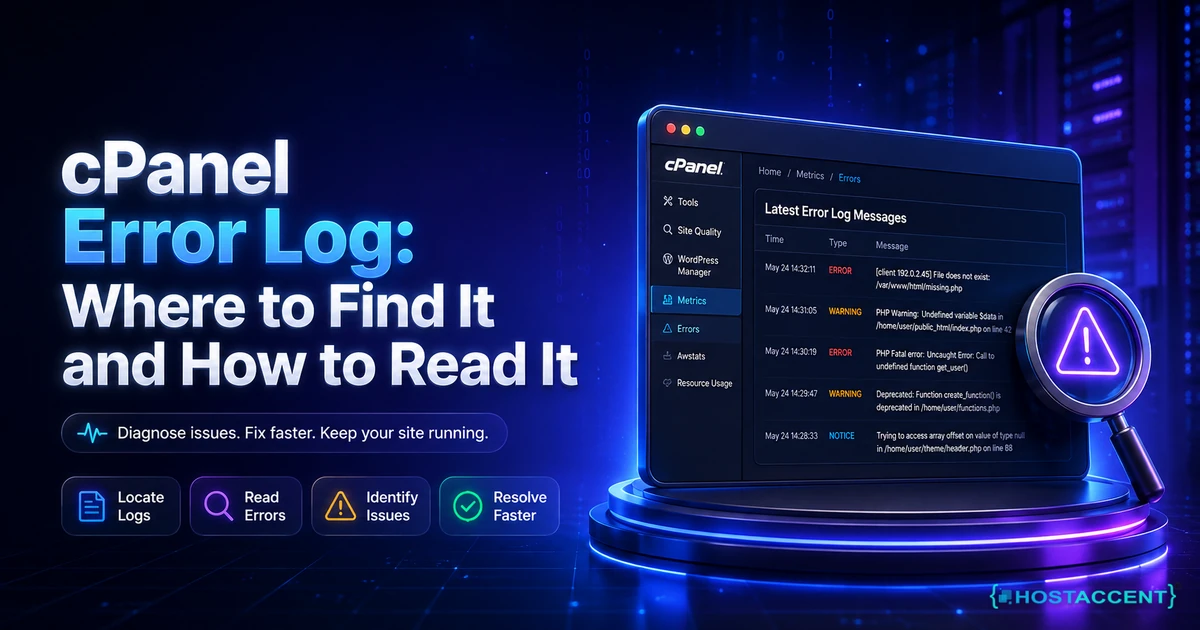
Route 1: Metrics > Errors. Log in, scroll to the Metrics section, click Errors. You get the tail of your Apache error log, capped at the last 300 entries. Fast, no file browsing, good enough for the last few minutes of breakage. The cap is real though: on a busy site throwing repeated warnings, 300 entries can cover about ninety seconds of traffic.
Route 2: File Manager. Open File Manager, go to public_html, and look for a file named error_log with no extension. PHP running as suPHP or CGI writes per-directory logs, so a broken plugin in a subfolder may write to public_html/wp-content/error_log rather than the root. Check subdirectories before deciding the file does not exist.
Route 3: the logs folder. Modern cPanel servers running PHP-FPM keep a per-domain file at ~/logs/example_com.php.error.log, alongside the FPM log in the same directory. This is the richest source on a cPanel box, and it is the one most tutorials skip entirely.
A self-contained summary for anyone skimming: on a cPanel account as of September 2026, PHP errors appear in one of three files, namely the Apache error log shown under Metrics > Errors (last 300 entries only), a per-directory error_log file beside your scripts, or a per-domain FPM log inside the home directory's logs folder. Checking all three takes under two minutes and rules out roughly every shared-hosting logging question.
If the errors turn out to be resource ceilings rather than code faults, that is a different problem with a different fix, covered in Shared Hosting Resource Limit Exceeded: Causes & Fix (2026).
Reading Logs on a VPS: SSH, tail and PHP-FPM
Root access changes the game. You stop hunting through a file browser and start reading logs live, while the error is happening.
We call the following the 60-second log sweep, and it runs in the same order every time on our own servers. Three commands, newest entries last:
bashsudo tail -n 50 /var/log/nginx/error.log sudo tail -n 50 /var/log/php8.3-fpm.log sudo tail -n 50 /home/username/public_html/error_log
Nginx first, because FastCGI failures and upstream timeouts surface there before anything else. PHP-FPM second, because that is where worker crashes and pool warnings land. The application log last, because by then you know which layer actually failed.
To watch an error as you reproduce it, use sudo tail -f /var/log/php8.3-fpm.log in one window and reload the broken page in another. For systemd-managed services, sudo journalctl -u php8.3-fpm --since "10 minutes ago" gives you the same picture with timestamps attached.
The php-fpm error log path is set per pool, not globally. Open /etc/php/8.3/fpm/pool.d/www.conf and look for php_admin_value[error_log]. If it is commented out, your pool has no dedicated log and PHP messages get forwarded to Nginx instead, which is exactly why people tail an empty file and assume logging is broken. The full directive list lives in the PHP-FPM configuration reference.
Insider Insight: Set
catch_workers_output = yesin the same pool file. Without it, anything a worker prints to stderr goes to/dev/nullunder the FastCGI spec, so a fatal that kills the worker outright can vanish without a trace. This single line has ended more "there is nothing in the logs" tickets for us than any other change.
Memory pressure shows up here too, usually as workers being killed rather than as tidy PHP errors, and Why Is My VPS Running Out of RAM? How to Diagnose and Fix It walks through separating the two. Hostaccent's Basic VPS gives you root from day one, which means every path above is yours to configure, and choosing a location near your users (our Amsterdam VPS Hosting: High-Performance EU Servers guide covers the EU side) keeps the latency out of your debugging.
Still blocked at Cloudflare?
Send the error code, affected hostname, and recent DNS or SSL changes. We will separate edge, origin, firewall, and certificate causes before proposing work.
How to Enable PHP Error Logging When the File Stays Empty
If every path checked out and every file is empty, logging is off. Turning it on takes one of four routes depending on what your host allows, and only one of them is safe to leave running on a live site.
On cPanel, use the MultiPHP INI Editor. Switch to Editor mode, select your domain, then set log_errors = On, display_errors = Off, error_reporting = E_ALL, and error_log = /home/username/logs/php_errors.log. Create the logs folder first if it is not already there.
Without INI Editor access, drop a .user.ini file into your document root with the same four directives. PHP-FPM caches these files for up to five minutes by default, so wait before deciding it failed. On older mod_php setups, .htaccess still works using php_flag log_errors on and php_value error_log /home/username/logs/php_errors.log.
On a VPS, edit the pool file, set php_admin_flag[log_errors] = on and php_admin_value[error_log], then reload with sudo systemctl reload php8.3-fpm.
Why is my PHP error log completely empty?
Nine times out of ten the answer is permissions. PHP-FPM workers run as www-data (or the cPanel account user), and if that user cannot write to the log file or its parent directory, the error is dropped silently with no warning anywhere. Check with ls -la /var/log/ and compare the owner against the user = line in your pool config. Across the 10,000+ sites our team has launched and the 4,000+ migrations we have run since 2012, this one mismatch explains more empty logs than every other cause combined.
The second most common cause is simpler: you enabled logging in the CLI php.ini and your site runs FPM.
Leave display_errors off on anything public. Printing file paths, database names and framework versions to visitors is a genuine security handoff, and search engines will happily index a warning.
From the Ticket Queue: According to Hostaccent's support-queue data (September 2026), WordPress issues account for about 30% of the tickets we handle each month, with Linux server issues another 25%. The overlap between those two buckets is almost always a logging problem, not a code problem, because the fix is obvious the moment somebody can actually see the error.
The WordPress Debug Log File, Enabled Safely
WordPress has its own logging layer, and it catches things the server log never sees, including plugin notices, deprecated function calls and database query problems.
Open wp-config.php and add this above the line that says to stop editing:
bashdefine( 'WP_DEBUG', true ); define( 'WP_DEBUG_LOG', true ); define( 'WP_DEBUG_DISPLAY', false ); @ini_set( 'display_errors', 0 );
The wordpress debug log file then appears at wp-content/debug.log. Note the third and fourth lines carefully: they record everything while showing visitors nothing. Skipping them is how a site ends up displaying notices above the header on the homepage.
WP_DEBUG_LOG also accepts a path instead of true, which is the better habit. Point it somewhere outside the web root, such as define( 'WP_DEBUG_LOG', '/home/username/logs/wp-debug.log' );, because the default location is publicly readable on plenty of configurations. The full constant list is maintained in the official Debugging in WordPress documentation.
WooCommerce keeps a separate set under WooCommerce > Status > Logs, and its fatal-errors files are frequently the fastest route to a checkout problem.
Pro Tip: Turn debug logging off again once you are finished. A
debug.logcollecting one deprecation notice per page view on a moderately busy store can reach several gigabytes in a week. We have handled disk-full and inode-full emergencies where every site on a server went down at once, and an abandoneddebug.logwas the culprit more than once. If you must leave it on, add a logrotate rule.
Slow pages rather than broken ones point somewhere else entirely, and How to Fix High TTFB in WordPress (2026 Guide) covers that path.
How to Read the Log and Find the Line That Broke Your Site
Having the file open is half the job. Reading it correctly is the other half, and this is where most guides stop.
A PHP error line has four parts: a timestamp in brackets, the severity, the message, and the file path with a line number. Here is a typical fatal:
bash[12-Sep-2026 09:14:52 UTC] PHP Fatal error: Uncaught Error: Call to undefined function wc_get_order() in /home/user/public_html/wp-content/ plugins/example-plugin/includes/orders.php:184
Read it right to left. The file path names the offender (a plugin, in this case), the line number takes you to the exact statement, and the message tells you a function was called that does not exist, which usually means a dependency was deactivated or a plugin was updated out of sequence.
Three habits make log reading fast:
- Scroll to the bottom first. Logs append. The newest entry is last, and the newest fatal is almost always your problem.
- Ignore notices and deprecations until the fatals are gone. A log can carry thousands of harmless notices.
grep "PHP Fatal" error_logcuts straight through them. - Match the timestamp to when the site broke. An error from three weeks ago is background noise, not your outage.
Watch for two specific patterns. "Allowed memory size of 536870912 bytes exhausted" means PHP hit its memory_limit (512M in that example) and is a resource problem, not a syntax problem. "Maximum execution time exceeded" points at a slow external API call or an unindexed database query, and raising the timeout only hides it.
The takeaways worth keeping:
- Ask PHP where its log is with
ini_get()rather than guessing from a tutorial. - On cPanel, check all three locations before concluding the log is missing.
- On a VPS, run the 60-second log sweep in order: Nginx, then FPM, then the application.
- If the file is empty, suspect permissions and the CLI-versus-FPM configuration split.
- Log everything, display nothing, and switch WordPress debugging back off when you are done.
Your Next Step: A Server Where Logs Are Already in Place
Now that you know how to check PHP error log files on three different stacks, the tedious part is the plumbing: pool configs, log paths, ownership, rotation. You can wire all of that up yourself over a weekend, or start on a server where root access is yours immediately and a real engineer answers when something breaks at 3am. The Hostaccent Basic Linux VPS at $7.99/mo, renewing at $7.99/mo, includes full root access, NVMe storage, free 30 Gbps DDoS protection and a 99.9% uptime guarantee. One honest caveat: no VPS plan here bundles a cPanel or Plesk licence, because those licences cost real money (cPanel alone runs north of $30/mo), so budget for one separately or stay on shared hosting. Start on the Basic VPS plan and keep your logs somewhere you can reach them.
Frequently Asked Questions About Checking PHP Error Logs
Where is php error log located on shared hosting?
On most shared accounts it sits in one of three places: a file named error_log inside your document root or a subdirectory, a per-domain file under ~/logs/ such as example_com.php.error.log, or the panel's built-in viewer (Metrics > Errors in cPanel). The exact path depends on your host's PHP handler. The reliable way to settle it is loading a script containing ini_get('error_log') from your own site and reading what it prints.
How to check PHP error log files if I only have FTP?
FTP is enough. Connect with an FTP client, open your document root, and download any file named error_log, then check wp-content/ and other subfolders because per-directory logs are common. Also look in a logs folder one level above the web root if your account exposes it. For WordPress specifically, add the debug constants to wp-config.php over FTP, reproduce the error, then download wp-content/debug.log. No terminal access required at any point.
Why is my error_log file empty when my site is clearly broken?
Usually one of four reasons. The PHP user cannot write to the file or its directory, so errors are discarded silently. Logging is enabled in the CLI configuration but your site runs PHP-FPM, which reads a different file. The pool has no error_log directive set, sending messages to the Nginx log instead. Or catch_workers_output is off, so a fatal that killed the worker never got written. Check permissions first, it is the most likely culprit.
Does enabling PHP error logging slow down my website?
Barely, under normal conditions. Writing a few log lines per day costs nothing measurable. The cost appears when a site throws thousands of notices per minute, because every entry is a disk write, and on a busy server that competes with real traffic for I/O. The bigger practical risk is disk space rather than speed: an unrotated log on a chatty site can consume gigabytes in days and take every site on the server down with it.
Should I delete the error_log file after I fix the problem?
Deleting it is safe, and the file is recreated on the next error. Renaming it to error_log.old is the better habit, because you keep the history in case the problem returns and you need to compare timestamps. On cPanel, per-directory logs never clear themselves, so old ones accumulate quietly for years. When we are diagnosing a recurring fault, our own engineers at Hostaccent still open those archived files first, because a repeating pattern tells you far more than a single entry.
What is the difference between the WordPress debug log and the PHP error log?
They capture different layers. The PHP error log is written by PHP itself and records everything the interpreter chokes on across the whole account, including non-WordPress scripts. The WordPress debug log is written by WordPress and adds framework-level information: deprecated hooks, database query warnings, plugin notices. A fatal error normally appears in both. A deprecated WordPress function appears only in debug.log, which is why checking both is standard practice.





Discussion
Have a question or tip about this topic? Share it below — your comment will appear after review.